After a bit of Googling I found that an easy way to measure localised airflow is with a hot wire anemometer. These heat a wire by passing a current through it and then measure how much the airflow cools it. The current and voltage can be used to determine both the resistance and the power dissipation using Ohm's law. The resistance can then be used to determine the temperature knowing the thermal coefficient of the metal that the wire is made from. The extra heat loss due to the airflow is proportional to the square root of the flow rate.
A popular circuit configuration is a constant temperature anemometer as described here, but note the op-amp inputs are labelled incorrectly. An op-amp is used to adjust the voltage across a Wheatstone bridge to keep it in balance. The bridge consists of three fixed resistors and the hot wire, so when it is balanced the wire has a known fixed resistance determined by the other three. Because the power is controlled to keep the resistance constant it follows that the temperature of the wire is constant. The voltage on the bridge can then be used as a measure of the heat carried away by the airflow.
Tungsten is commonly used for the hot wire, presumably because it has a reasonably high resistivity, temperature coefficient and resists oxidisation. I hatched a plan to use a small light bulb with the glass removed, mount it on the bed of a printer and move it around under the fan duct to plot a map of the airflow.

This is a small 12V 0.8W bulb. Its cold resistance is about 15Ω but more than ten times that when hot. This is why bulbs take a massive surge current for a few milliseconds when they are switched on.
I was wondering about how I was going to calibrate the airflow reading but then realised that the flow rate is not actually what I am interested in. It is the cooling effect the airflow has, which is what I am directly measuring. The result is simply the extra power needed to maintain a target temperature and is a measure how fast the bulb filament is being cooled. So rather than an anemometer I decided to call it a coolometer. Unfortunately Futurama used that name first. Rather than displaying megafonzies mine displays milliwatts!
This is the circuit that I came up with: -

Q1 is a PNP emitter follower that amplifies the current that can be sunk and also acts to shift the output voltage range 0.7V higher. R3 and R2 further shift the voltage so the output swing can turn Q2 fully on or off. The side effect is they reduce the loop voltage gain but Q2's voltage gain will more than make up for that. It further boosts the current to drive the low resistance bulb and allows the bridge voltage to swing over the full supply range. If I was designing using modern components I would use one of the true rail to rail op-amps from Maxim and save a transistor.
VR2 is an offset null adjustment. I didn't think one would be needed at first because a small input offset isn't going to affect the output much in this circuit. However I soon realised that there are two stable states, one where the bridge is in balance and the other where the voltage supply to the bridge is zero. To force the circuit into the non-zero state I had to ensure there was a small but finite negative input offset.
I was a bit worried that adding more voltage gain after the op-amp might cause it to oscillate like my ULDO regulator did. However it appears to be stable with just the op-amp's internal frequency compensation. That must be because the transistors have a much higher frequency response than the op-amp, so don't add much extra phase shift within its bandwidth.
To measure the results, display them and send them to a serial port I used a MicroView. This is a tiny module combining an OLED display and an Arduino. I got four of these from the Kickstarter campaign. They are relatively expensive for what they are but I got four for the price of two because Sparkfun sent the first ones out without a bootstrap and had to replace them all. Since I have an ISP programmer it was trivial to install bootstraps into the first two.

The MicroView measures the voltage on the bridge and also the voltage across the bulb. With those measurements and knowing the value of R1 it can calculate the resistance and power dissipation of the bulb. Given the thermal coefficient of tungsten and cold resistance of the bulb it can estimate its temperature.
I didn't use the USB serial converter that goes under the MicroView because I wanted a micro USB socket rather than a full sized plug and I also wanted a lower profile, so I used one of these instead.

Because I wanted to test the circuit on a breadboard and then move it to perfboard I decided to try out fritzing. I was impressed by its ease of use. One bugbear of mine with traditional ECAD is the separation of the schematic and layout into different programs. You have to export your schematic as a netlist and import it into the layout program. Then there are horrible things like back annotation and cross probing. I have long argued it should be a single model with two views that are kept in sync. Having written a UML CASE tool myself, which has 15 different tabbed views of the same database that are always in sync I know this isn't too difficult to do.
Fritzing has breadboard, schematic and PCB views that are all synchronised. You can add, remove and connect components in any view and it will be reflected in the others. One thing I found quirky was that nets seem to preserve the order of connection, so you have to route the PCB or breadboard in the same order as the schematic. You can get around this by making tracks double back over themselves but in my mind a net should represent connectivity without an order of connection.
You can find the fritzing project here: fritzing.org/projects/coolometer
Here is my perfboard layout: -

You can see the offset null pot was a late addition connected with flying leads on the back. I left the un-routed rats nest to represent those.
I am not a fan of the radial components being shown on their sides. It makes some sense for simple breadboard projects but I would prefer a strict plan view.
The breadboard view can show a traditional breadboard or stripboard. The perfboard view is just a variation of the stripboard pattern, it simply replaces the strips with pads. The problem is that with perfboard you also need to put wire tracks on the back of the board as well as jumpers on the top. There is no way to represent that in fritzing 0.9.2, so I had to print it out and hand mark the underside tracks with a pen to actually be able to build it.
There are quite a lot of part libraries about that contain parts aimed at hobbyists like the MicroView. As they are contributed by different people / companies there are inconsistencies in the sizes and style of schematic symbols. For example the pots should be the same size as the other resistors and being trimmers should have a flat slider instead of an arrow. The arrow should meet the zigzag, not go through it, that would be a two terminal variable resistor. This appears to be a cross between the two. As fritzing appears to be aimed at education I think it is important for the symbols to be correct.
I do like the old school resistor symbols but they were replaced with boring boxes by standards organisations in the nineties if I remember correctly.
I failed to find a part for the CA3140, so I used a random op-amp that had a sensible looking symbol. Unfortunately the offset null pins of an OP27 didn't match the footprint of a CA3140, hence why it appears to be connected to an NC pin on the schematic. I tried to modify it to match my part but failed. Part creation is external to fritzing.
I also made a PCB layout just to try it out, I have no intention of making a PCB as this is a one off for an experiment. Auto route works but is ugly, as always, so I hand routed it as I always do.

A view with the pictorial version of the components would be nice. Note that the footprint of the pots is different to breadboard view. It actually matches the pots I used though.
Again it is very easy to use for simple designs like this. I think it is limited to two layers and I don't think it can do thermal vias. It can do copper fills. I will probably stick with KiCad for more complex designs.
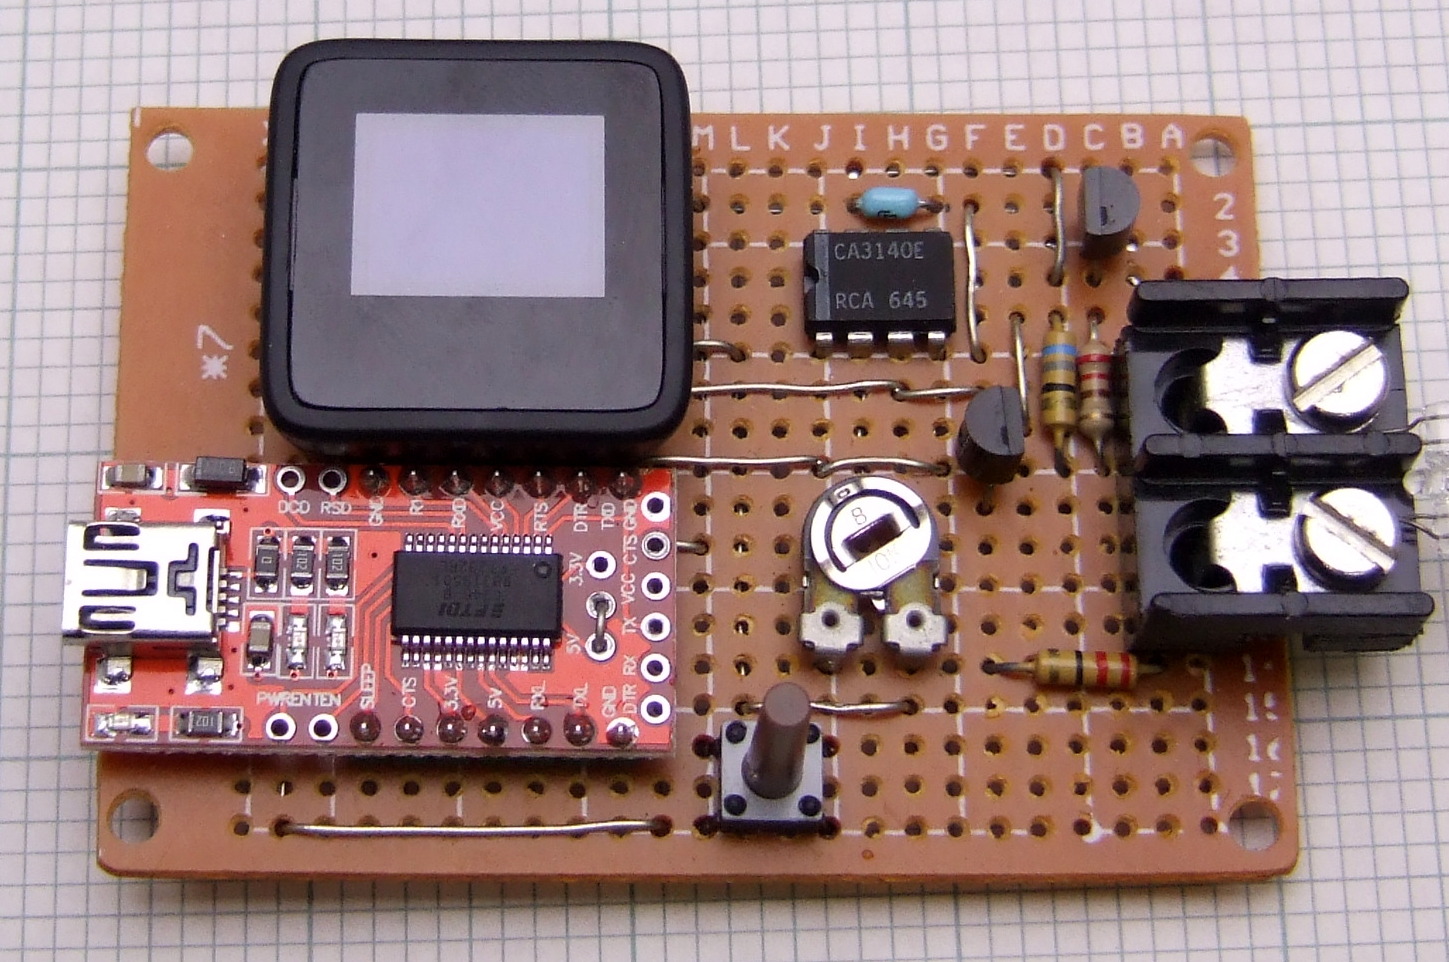
Here is the built up perfboard version. Note that this picture was taken before I added the offset null pot.
Here is the underside :-

I made a 3D printed case of course, using OpenSCAD. It was a great help that there was a 3D model of the MicroView case parts available in STL format. I was able to assemble them to make an accurate 3D representation of it and also use it to cut the hole in the case lid. Once I had measured up the perfboard I was able to locate all the components that needed holes in the case by using their grid coordinates. Amazingly this was right the first time I printed it.

I used HEATFIT brass threaded inserts which I pushed in using a soldering iron with a conical bit.

Here it is assembled and running. Unfortunately the camera shutter missed the most important bits of the text, the temperature and power.

The cheap perfboard I used was a bit warped so the board is sandwiched between the top and the base, supported all around its edges top and bottom, and clamped with four screws. The screw heads are recessed into the base so that it sits flat.
When I was following instructions to install the MicroView bootstrap I discovered CodeBender. This allows you to store an Arduino project in the cloud, edit it in a web page, compile it in the cloud and download into an Arduino using a web browser plug in. It's much more convenient than installing hundreds of megabytes of Arduino IDE and the editor is much nicer. Here is the actual code: Click on the title to see a non-embedded version in its own webpage.
The MicroView doesn't have any separation between the analogue and digital power rails so I guessed the ADC readings would be quite noisy. I knew that the AVR can be made to sleep while the ADC is sampling to reduce the amount of digital noise. I scraped some code from the Arduino forum to do that. Ten bits is not a lot of resolution so I do 16 reads in quick succession and add them together to get a 16 bit result. In the presence of random noise oversampling can increase the resolution at the expense of the sample rate. Marlin firmware uses this technique for reading temperatures.
The ADC uses the 5V rail for its reference but the actual voltage at the end of a USB cable is somewhat unknown, so I measure the internal bandgap reference to calibrate the other two voltage readings.
Once the glass is removed from the bulb the voltage becomes quite unstable. I think this is because of chaotic air turbulence. I first noticed this effect when using a thermocouple to measure the temperature at the surface of a heated bed. The control loop might be somewhat unstable due to it having a high gain and bandwidth controlling a laggy heater. It may tend to over correct and overshoot. Despite this I found that averaging over 100 samples gave a stable reading.
The firmware displays the three voltages it measures (VCC, the bridge voltage and the bulb voltage) averaged over the last 100 samples. It also displays the calculated power and temperature of the bulb.
I adjust VR1 to set the temperature to 185°C to emulate freshly extruded filament. I don't think the exact temperature matters much. Making it higher increases the sensitivity but there may not be enough voltage to maintain it in a strong airflow. Also you probably don't want it glowing as it might oxidise. It takes a lot more power to reach a given temperature once the glass is removed, obviously, as you have convection cooling even in still air rather than just radiation.
Pressing the button causes it to subtract the current power level from subsequent readings. That is done in still air so that the power reading is then just the extra heat carried away by a moving airflow.
The serial protocol is minimal. If it receives z it zeros the power and replies ok. If it receives s it clears the sample buffer and replies ok. After it gets 100 samples it sends VCC, the bulb power and the bulb temperature.
As this article is long already I will show the results in another post. In the meantime here is a scan of the standard Mendel90 fan duct's cooling effect at 2mm resolution.


Having used your UML CASE tool may I assume that UNDO is hard to do? Joking of course..although it would have been handy.......
ReplyDeleteEasier if you think to design it in at the start, but still nearly twice as much code.
DeleteHi Chris,
ReplyDeleteGreat experiment and write-up. Love the Futurama tie-in. :-)
How did you map the readings to positions on the heated bed (apologies if I've missed that in the detail), and how high off the bed was the fan duct?
Ivor
Hi Ivor,
DeleteHow I gather the readings in detail will be in the next post. Basically I place the instrument on the bed and drive it around with gcode from a python script that also talks to the coolometer to get the data. The nozzle was 45mm above the bed to just clear the bulb filament. The bulb was mounted vertically off the screw terminals.
Excellent. Look forward to the next post.
ReplyDeleteAlso, delighted to see you blogging again. Always interesting reading.
Tks.
I.
Hey nophead,
ReplyDeletethis is Vasilis, the founder of codebender. It's great to see that you found out about codebender, and I'm glad you like it! I've followed your stuff for quite a while, and it's great to see people in the RepRap community embracing codebender ;)
Hi Chris, it's really great to see you blogging again! Some physics, some electronics CAD, some embedded source code, some PC side scripting and some source based CAD models and all that goodness combines to improve the shared 3D printing knowledgeable. I will try to keep my eye on blogspot again, which hasn't been as interesting since you "left". :)
ReplyDeleteThanks Eric,
DeleteHope things are still going well for you at Ultimaker.
This is an awesome idea! I work with fluid thermodynamics and recently made some E3D V6 improvements on UM+ but the only way to test them is to print small objects and overhangs. If you have time and are willing, perhaps you can make and test one shroud for 30mm fan which I find very efficient but am unable to "quantify" the efficiency
ReplyDeletehttps://www.youmagine.com/designs/e3d-v6-30mm-clip-on-fan-shroud